At a Glance
EASIEST TO USE
Excel is the user interface - easy, familiar, intuitive. It's where analysis, data entry and what-if's take place, and where reports are viewed. Only it's better than raw Excel. Models are personalized and protected with security down to the cell level. Updates are made live to corporate cubes and tables. Consolidation and allocations are instantaneous. No links. No macros.
EASIEST TO DEPLOY
The secret lies in our patent pending Spreadsheet Automation Server - the heart, soul and brains of A3 Modeling - which unifies the entire Corporate Performance Management feature set of A3 Modeling including Input Models, Reports, Dashboards, Real-time Consolitation, Ad-hoc Analysis, Workflow, Security... everything. With just spreadsheet and cube design skills, configure and maintain your own solutions with a fraction of the professional consulting and programming of traditional solutions.
LOWEST TOTAL COST TO OWN AND MAINTAIN
Easiest to use? Easiest to deploy? Lowest cost to own! For many of the same reasons that A3 Modeling is easier to use and deploy - unified codebase, single point of maintenance of security, data source connections, and metadata, reduced consulting, no programming - it is also much lower total cost to own and maintain.
|
|
KPI Dashboards & Balanced
Scorecards
Monitor Business Performance Visually
Configure standardized KPI Dashboards and Balanced Scorecards that bring everyone
in your organization onto the same page. A3 Modeling offers the right balance
of centralized control over layout and metadata and end-user freedom to
tailor for specific needs.
Easily navigate and monitor variances, trends, and objectives at all levels
of the organization for which you have security authorization. See an exception?
Intuitively follow the money with ad-hoc drilldown and analysis.
KPI Dashboards
- Drive Alignment. Accelerate Consensus.
- Configure a library of dashboards to which end-users can subscribe
- Design each dashboard with its own theme – e.g., revenue, spending,
inventory, human resources.
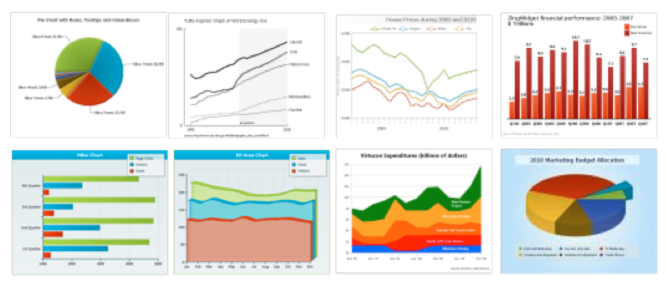
- Choose from a variety of available charts and graphs to create the
most visually meaningful view
- Grant end users the appropriate level of freedom to interact with the
dashboards
Balanced Scorecards
- Convert Strategy into Execution
- Design a standardized scorecard layout for controlled distribution
- Include charts, graphs, tables, $'s, statistics, and textual data
- Track progress, flag variances
- Flag discrepancies and drill down for further ad-hoc analysis
|
|
|
